Commercial vacancies in Belmont Cragin, Chicago, IL
The map gives a way to explore vacant storefront in the Belmont Cragin neighborhood in Chicago, IL, and provides information on each of them.

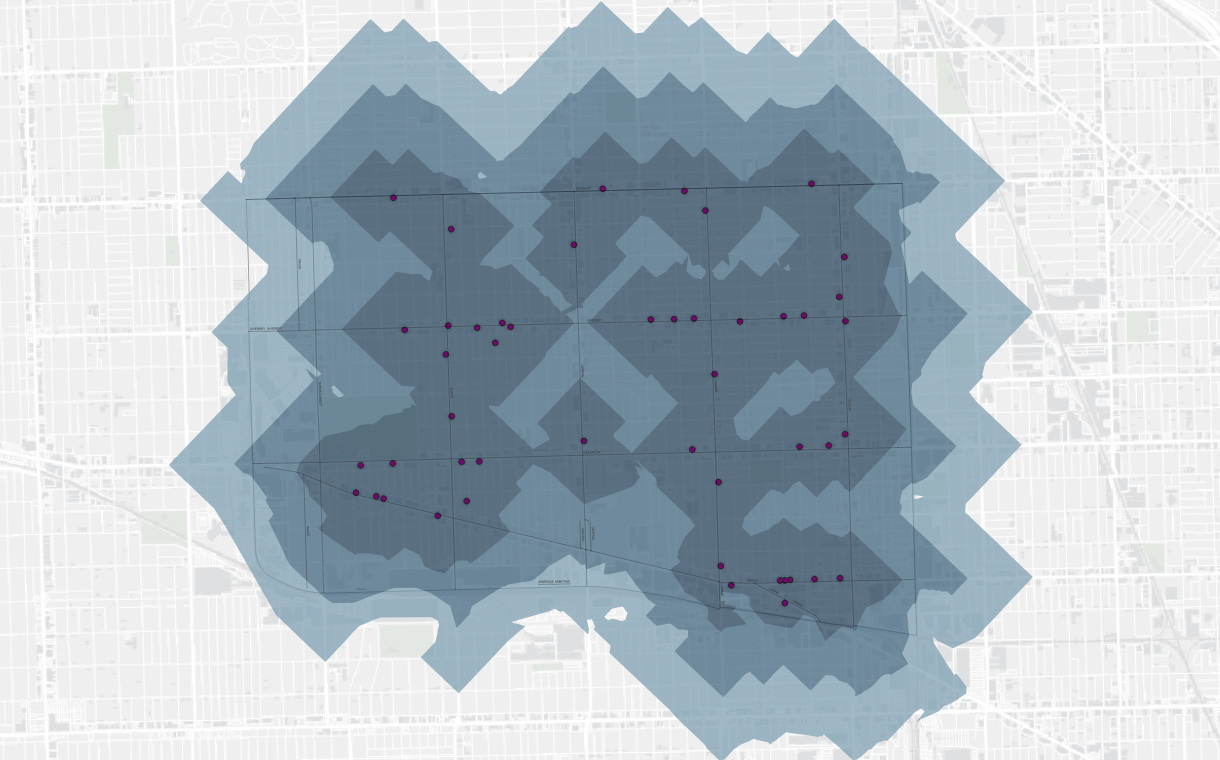
Urban rats complaints in Chicago, IL
The map provides insights on exposure to rats and city's response to them across neighborhoods in Chicago, IL.
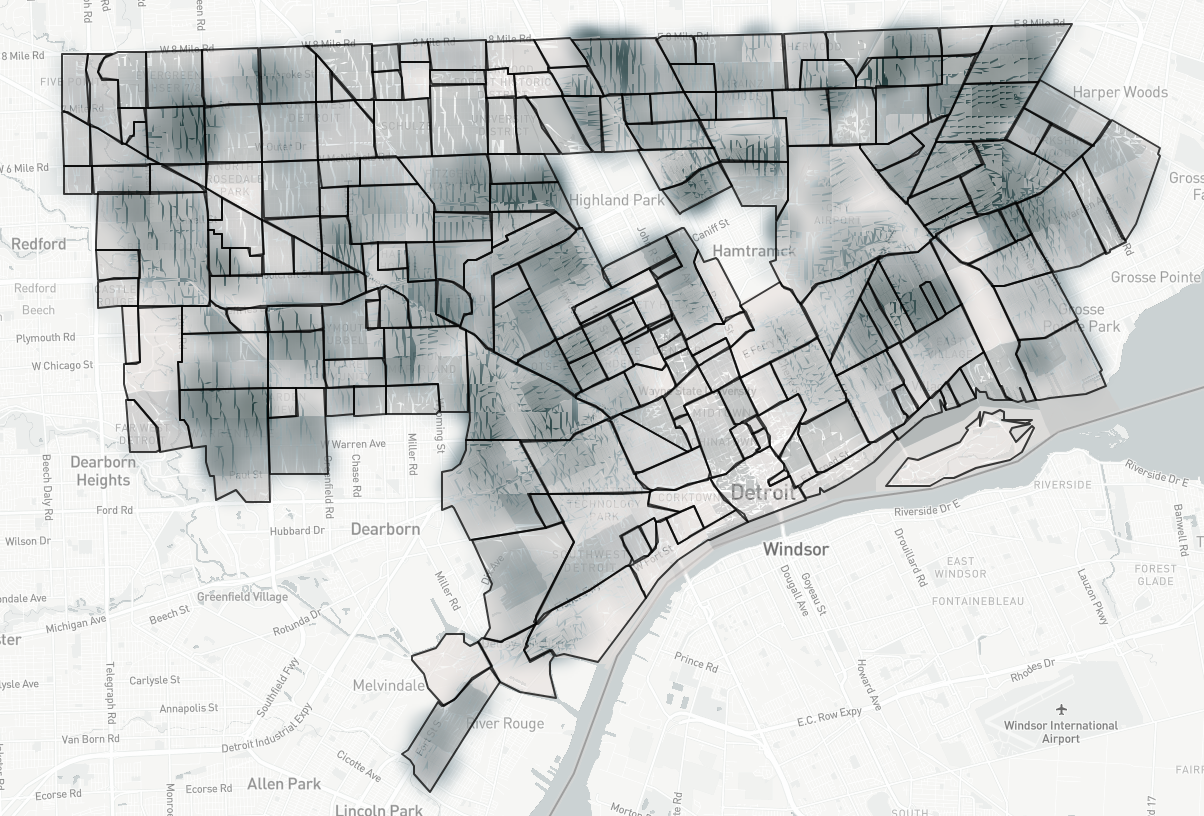
Residential demolitions in Detroit, MI
The map represents the dynamics of demolitions in Detroit since 2014. It shows how different neighborhoods were changing over time and which were most affected by the demolitions.
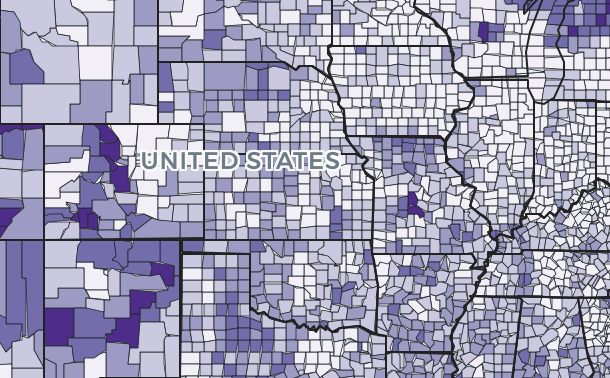
Housing occupancy in US per county
The social fabric of city neighborhoods can be changed dramatically due to vacancies. It can also be preceived less stable, if the rate of rentals becomes "too high". The map shows the rate of vacant and occupied housing per county in the US.
Public transportation accessibility in Lexington, KY
U.S. Department of Transportation suggests 1/4 mile as an optimal distance to the bus stop.
If it requires more to reach the nearest stop, a person will probably want to consider other transportation options. This distance is used to define which areas in the city are served with public transportation in Lexington. There are many areas in Lexington, which are underserved with public transportation.
Data acquired from OSM. Software used: QGis 3.20, MacOS Monterey. Coordinate system: ESPG: 3089 / NAD83 / Kentucky Single Zone (ftUS).
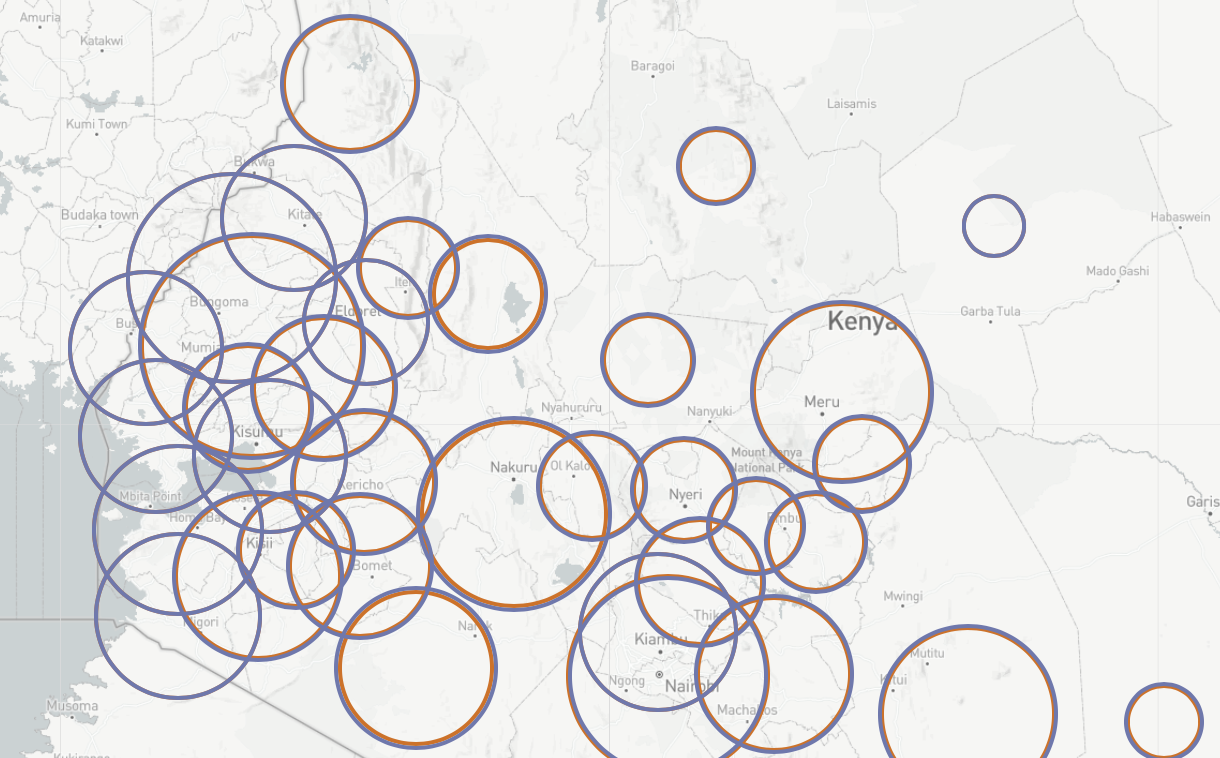
Primary Education in Kenya, 2014
According to the World Bank, Kenya is consistently improving the quality of school education. It includes increasing the number of teachers, enrollment, and financing schools. However, there are huge regional inequalities in all education outcomes throughout the country.
Late Coffee in Lexington, KY
Lexington is well adjusted for morning people. They can enjoy all kinds of amenities open for them, when they wake up and start the day. But what about those who wake up at noon, hardly get out of their bed by 2pm, and still crave coffee at 6pm? How many opportunities do they have? Based on the opening hours of local coffeshop provided by OpenStreetMap, I created a map of places, where you can still get a cup of hot coffee after 6pm. The results are not inspiring.
Data acquired from OSM. Software used: QGis 3.20, MacOS Monterey. Coordinate system: ESPG: 3089 / NAD83 / Kentucky Single Zone (ftUS).
Major Waterways of Kentucky
Visualization of major waterways in Kentucky.
Data source: The National Map
Small-Scale website
Software used: QGIS 3.22 and macOS 10.15.7. Coordinate system: ESPG: 3089 / NAD83 / Kentucky Single Zone (ftUS).
Wind Turbines of the State of Michigan, 2022
A map of Wind Turbines in the State of Michigan suggests a closer look to wind turbines in the State of Michigan and their proximity to cities, villages and roads.
Data used: United States Wind Turbine DataBase (U.S. Geological Survey, American Clean Power Association, and Lawrence Berkeley National Laboratory data release); Natural Earth,
US Census Bureau, Geography Division.
